What is Doppler ultrasound?
Pierre Vassallo
The term Doppler should be capitalized because it refers to Christian Johann Doppler, an Austrian physicist (1803–1853). He described a phenomenon whereby the frequency of sound changes when it is reflected off a moving object. If the object is moving towards the observer, reflected sound frequency is increased (blue shift), while if the reflecting object is moving away from the observer, the sound frequency decreases (red shift). This is analogous to a moving ambulance with its siren on; the siren pitch increases as ambulance approaches and decreases as it receeds.
The Doppler Effect may be used also in ultrasound. With normal grey scale ultrasound we rely on amplitude of reflected sound waves and the reflectivity of anatomic structures is proportional to the intensity (or amplitude) of the reflected sound and hence brightness on the scanner display. If frequency (rather than amplitude) is analysed, one can detect motion on the basis of Doppler shifts. These frequency shifts can be quantified reasonably accurately according to direction, velocity and also acceleration, all of which provide specific signatures that help identify both normal and diseased blood vessels.

Frequency shifts in ultrasound may be displayed in two fashions; they may be presented on a graphical plot showing velocity on the y axis and time on the x axis, this is called spectral Doppler ultrasound, or they may be colour coded with blue or red indicating direction of flow towards or away from the ultrasound probe and colour intensity being proportional to flow velocity, this is called Colour Doppler ultrasound. Spectral Doppler is a valuable tool to evaluate blood flow patterns quantitatively whereas Colour Doppler provides a more graphical depiction of vascular anatomy similar to an X-ray angiogram (Figure 1).
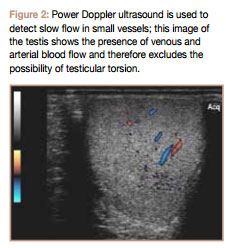
There is a third mode of presentation is a variation on the Colour Doppler technique called Power Doppler ultrasound, whereby the colour intensity does not reflect the mean flow velocity at each point in time but all flow velocities summated; this provides less indication about the character of the blood flow but is much more sensitive to small vessels and slow blood flow (Figure 2).
Arterial Spectral Waveforms
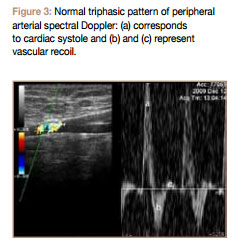
Spectral Doppler waveforms can be used to identify blood vessels (“vascular signatures”). Classical peripheral arterial flow has a triphasic pattern (Figure 3) with the first phase (largest wave) reflecting cardiac systole and the subsequent two phases correlating to healthy arterial wall recoil. Loss of the second and third phases resulting in a biphasic or monophasic pattern indicates loss of arterial wall elasticity that results from atherosclerosis.
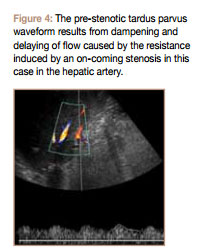
Loss of wave amplitude and a delayed peak are the results of arterial stenosis located distally; this is referred to as a tardus parvus waveform (latin translation for late and low) (Figure 4). High wave amplitude means that there is acceleration of blood flow; this occurs at the site of vascular stenosis (Figure 5). This phenomenon can be reproduced by pinching the end of your garden hose; this will obtain a more powerful jet to transmit water to farther corners of your garden. Both peak systolic and end diastolic flow velocities are increased at the site of stenosis. Distal to an arterial stenosis, peak systolic flow velocity is still increased but to a lesser extent while end diastolic flow velocity is diminished or absent (Figure 6).
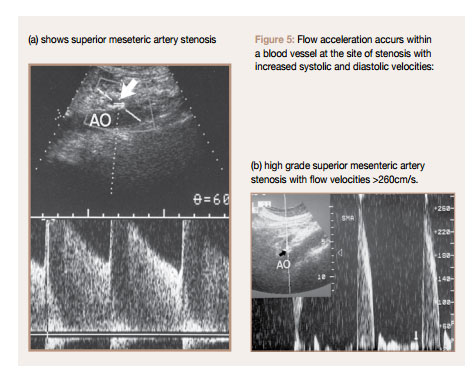
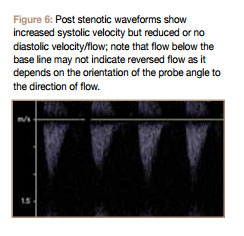
Distal to an arterial occlusion there is no flow; this is termed an aphasic (b) high grade superior mesenteric artery stenosis with flow velocities >260cm/s. Figure 6: Post stenotic waveforms show increased systolic velocity but reduced or no diastolic velocity/flow; note that flow below the base line may not indicate reversed flow as it depends on the orientation of the probe angle to the direction of flow. Figure 5: Flow acceleration accurs within a blood vessel at the site of stenosis with increased systolic and diastolic velocities: (a) shows superior meseteric artery stenosis flow pattern (in distinction to mono-, diand triphasic flow patterns described earlier.
In a normal healthy state, arterioles have the capacity to change their resistance to divert flow toward the organs that need it most. Organs that need to be “on” have their arterioles relaxed so that they are appropriately perfused. When an organ is on “power save” mode, its arterioles constrict and flow is diverted to other organs. The brain, the liver, the kidneys and the gonads need to be “on” at all times, so its arterioles are relaxed. During rest, skeletal muscles are on “power save” mode so their arterioles are constricted. The same can be said for intestinal vessels in a fasting state (which is the case during most abdominal ultrasound examinations). During active physical exercise, skeletal muscle arterioles relax to allow delivery of more oxygenated blood to those tissues. The same holds true for intestinal arterioles in the post-prandial state. Arteriolar tone can be analysed with spectral Doppler imaging by observing the relationship of peak systolic and end diastolic flow velocities; when the arterioles are open end diastolic flow is high, while when they are closed it is low. Peak systolic flow is essentially constant in both states.
The factor most commonly used to assess arteriolar tone (and hence organ activity) is the Resistive Index, which is calculated as follows:
A high RI (>0.7) occurs when an organ is in “power save” mode, while a low RI (0.55-0.7) is seen when the organ is “on”. RIs outside of the range expected for the organ’s state usually indicate disease. In the hepatic artery, a high RI may indicate a post prandial state (ie patient did not fast) or diffuse distal microvascular disease as seen in chronic liver disease such as cirrhosis or chronic hepatitis. A low RI in the hepatic artery is more indicative of disease and may occur with proximal arterial stenosis or distal arteriovenous or arterioportal shunting as may occur in severe cirrhosis. Other indices besides RI that are used to assess arteriolar tone are systolicdiastolic ratio (PSV/EDV) and pulsatility index (PI =(PSV-EDV)/Vmean).
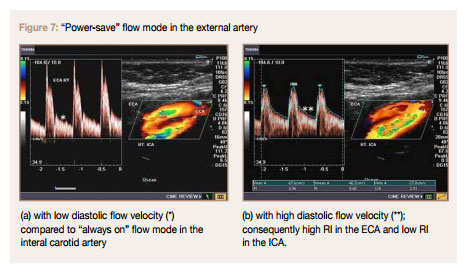
Central arteries have a monophasic pattern with only antegrade flow unlike peripheral arteries that show recoil. This is due to low arteriolar tone that ensures delivery of blood to central organs at all times. RI will however differ depending or organ requirements with the internal carotid and hepatic arteries having a lower RI (RI 0.55-0.7) than the external carotid and renal arteries (RI > 0.7) (Figure 7). RI values also change with organ state; the hepatic arterial RI in the fasting state is higher (>0.7) than that in the post prandial state (0.55-0.7). A persistently high hepatic arterial RI may be seen in patients of advanced age and diffuse peripheral microvascular (arteriolar) compression or disease, as seen in chronic hepatocellular disease (including cirrhosis), hepatic venous congestion, cold ischemia (post-transplantation), and any stage of transplant rejection. Low hepatic arterial RI may occur with proximal arterial narrowing (transplant hepatic artery stenosis, atherosclerotic disease [celiac or hepatic], arcuate ligament syndrome) and distal (peripheral) vascular shunts (post-traumatic or iatrogenic arteriovenous fistulas, cirrhosis with portal hypertension and associated arteriovenous or arterioportal shunts, Osler-Weber-Rendu syndrome with arteriovenous fistulas).
Venous Spectral Waveforms
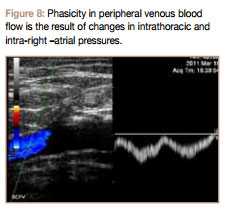
Venous Spectral Waveforms normally show less pulsatility than arterial ones. Since the sysetmic venous system is returning blood to the heart, the flow direction is resversed compared to arterial flow. Also since blood is being transfered to the chest, changes in intrathoracic pressure will affect flow velocity with increased flow during inspiration (due to negative intrathoracic pressure) (Figure 8).
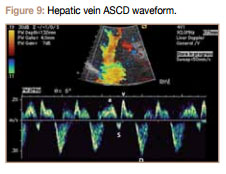
When evaluating flow pattern in systemic veins that are closer to the heart (eg jugular and hepatic veins), changes in right atrial pressure also influence flow. Thus an ASVD waveform similar to that seen in the both jugular and hepatic veins (Figure 9 ASCD in hepatic veins) with an upward A wave corresponding to right atrial contraction, a downward S wave resulting from antrio-ventricular spetal traction caused by ventricular contraction that reduces intra-atrial pressure, a V wave that correlates with right atrial filling, and a D wave correlating with opening of the tricuspid valve. Thus an abnormal tricuspid valve (stenosis or reguritation), right heart failure or a cardiac septal defect will result in abnormal hepatic venous flow waveforms.
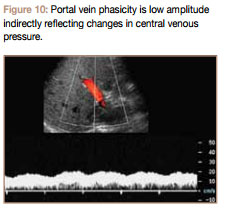
waveforms. The portal venous waveform differs from systemic ones in that changes in intrathoracic and right atrial pressures have less of an influence on flow due to the intervening liver. The normal portal venous waveform should gently undulate and always remain above the baseline. The peak portal velocity (V1 ) corresponds to systole, and the trough velocity (V2 ) corresponds to end diastole (Figure 10). Abnormally high pulsatility in the portal vein may be due to cardiac causes as is seen in tricuspid regurgitation and rightsided CHF or due to arteriovenous shunting (as seen in severe cirrhosis) or arteriovenous fistulas (as seen in hereditary hemorrhagic telangiectasia). Normal flow velocity in the portal vein is 16-40cm/s. Slow flow (<10cm/s) is seen in the portal vein in cases of cirrhosis with portal hypertension with no flow or flow reversal developing in severe cases. Note however that portal venous thrombosis (eg idiopathic or secondary to malignant disease) would also result in absent flow.
As is evident from the above data, Doppler ultrasound is a powerful tool that can help diagnose disease and also follow disease progression. Combining flow information with grey scale ultrasound findings can provide information that is unmatched by other imaging modalities. New flow encoding modatlities and more sensitive and low interference technologies have made Doppler ultrasound an indispensible tool in the diagnostic imaging department.