
Ultrasound Shear-Wave Elastography for Musculoskeletal Injuries
Pierre Vassallo
Greyscale and Doppler Ultrasound (US) are well established as first line imaging methods for the evaluation of musculoskeletal (MSK) injuries, often providing information comparable with that of magnetic resonance imaging (MR). However, early or minor injuries are often not detected by US. Ultrasound Elastography is proving helpful for the detection of injuries that are not detected by greyscale US and for monitoring healing of MSK injuries.
US Elastography evaluates the elasticity of tissues, which changes in different tissue states. Inflammatory change, tears and even muscle contraction result in alterations of tissue elasticity that are detectible with US Elastography. There are several different US-related technologies that have been used to measure tissue elasticity. The two main methods that are found on many new ultrasound scanners are Compression Elastography and Shear-wave Elastography (SWE). However, the value of measuring tissue elasticity is hampered by its limited reproducibility. SWE has received most interest for the measurement of tissue elasticity because it appears to be the most reproducible technique.
Review of recent scientific literature shows that SWE is useful for the assessment of many post-traumatic MSK conditions and to a lesser extent for inflammatory and neoplastic MSK lesions. It has been used to assess such conditions involving tendons, muscles, nerves and even ligaments. However, to date, SWE has been shown to be of greatest value in the assessment of tendons, followed by muscles and nerves.
The physics behind US Elastography is complex and a detailed explanation of the physical principles is beyond the scope of this article. However, in oversimplified terms, it involves the generation of a compression or shear wave produced by manual compression or by the same crystals in the ultrasound probe that generate ultrasound waves. The compression or shear wave travels perpendicular to the ultrasound wave beam and generates tissue movements (Fig 1). In stiffer tissues, the compression/shear wave propagates faster, whereas in softer (more elastic) tissues the wave propagates more slowly. The speed of compression/shear wave transmission (or any other value derived from this variable) is displayed on a colour scale ranging from red through yellow and green to blue based on tissue stiffness measurements. Reference should always be made to the colour scale displayed at the side of the image display as different companies may code low tissue elasticity (stiff tissues) as blue and high elasticity as red, while others may code in a reversed manner.
Tendons function as transmitters of tensile force from a muscle to its bony insertion during muscle contraction; they are therefore, by nature, stiff. Any increase in their elasticity would result in a decrease in the efficiency of muscle function. Healthy tendons therefore have high stiffness values on US Elastography. A decrease in elasticity seen in a damaged portion of the tendon will show a different colour on US Elastography (Fig 2). A complete tear in any portion of the tendon, where the gap is filled with fluid, would be depicted as showing no colour as there is no shear wave transmission (Fig 3). Note that coding of elasticity in Figures 2 and 3 is reversed, with high elasticity shown as red in figure 2 and blue in figure 3; this is unfortunately due to lack of standardisation between machine vendors, but is also due to different coding methods between compression Elastography and SWE. It is important to refer to the colour scale displayed at the edge of the image to understand the significance of the colours displayed.
US Elastography is useful for assessing small tendon inflammation. Increased tendon elasticity and synovial hypertrophy with high elasticity values in the synovial sheath are features of tenosynovitis (Fig 4).
Muscle tears, which most commonly occur in the myo-tendonous and myofascial junctions, are readily seen on grey scale ultrasound; US Elastography adds information by depicting the size and severity of the damage since the degree of increased elasticity reflects the severity of the injury (Fig 5).
The age of a muscle tear can also be assessed with US Elastography. Fresh tears are soft and hence exhibit increased elasticity, whereas older tears (or scars) are harder than muscle and hence shows diminished elasticity (Fig 6).
Contraction of muscles and tension in tendons results in a diminished elasticity and increased shear wave velocities (Fig 7).
US evaluation is useful in detecting peripheral neuropathy, however signs may be quite subtle and difficult to detect. Changes in cross-sectional shape (oval to round), thickening and altered echogenicity of the nerve are indicators of inflammatory disease. Normal nerves are of a relatively soft composition with high elasticity, while inflammatory disease results in decreased nerve elasticity (Fig 8).
US Elastography is a relatively recent additional tool that is showing promise for evaluation of the musculo-skeletal system. Further advances and standardisation of this technique as well as increasing scanning experience will contribute to its increased use for assessing musculo-skeletal trauma and inflammatory disease.
Figure Legends
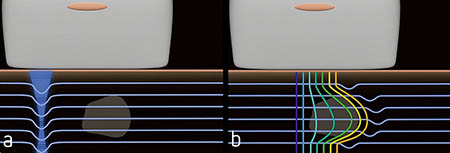
Figure 1. a. Diagram showing normal sound wave propagation as thin horizontal blue lines and shear wave generation as blue vertical band to the left. b. Note that shear wave travels horizontally through the tissues and causes shifts in the ultrasound waves that are dependent on tissue elasticity. These shifts are colour-coded to produce the elastographic image.
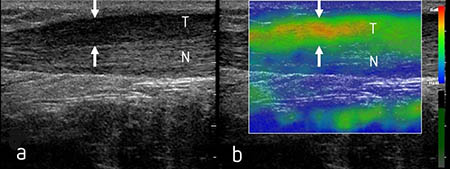
Figure 2. Grey scale (a) and compression elastographic (b) scans showing a longitudinal image of the Achilles’ tendon. The intact deeper portion of the tendon shows a normal fibrillar more echogenic texture (N) and has coded blue on the compression elastographic scan (b). The partially torn superficial portion of the tendon (arrows) exhibits diminished echogenicity (T) compared with the intact deeper portion tendon with loss of the fibrillar pattern on grey scale US and shows evidence of increased elasticity coded as red and yellow on the compression elastographic scan.
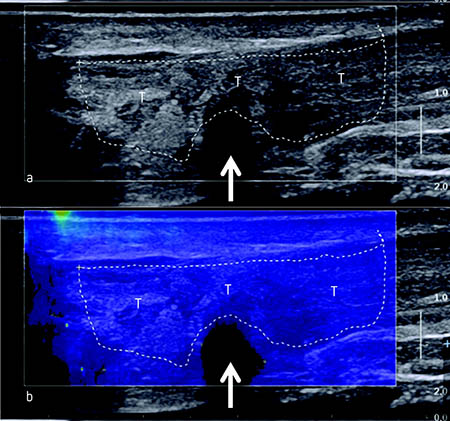
Figure 3. Grey scale (a) and SWE (b) scans depicting a longitudinal section through the Achilles’ tendon. (a) The grey scale image shows a very heterogeneous echotexture in the Achilles’ tendon (T) with loss of the fibrillar pattern indicating extensive tendon damage as well as an anechoic (fluid filled) area (arrow) that represents a complete tear at that site (arrow). (b) The SWE shows high elasticity throughout the damaged tendon coded blue with no colour in the complete tear (arrow).
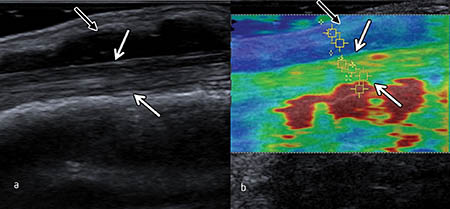
Figure 4. Grey scale (a) and SWE (b) scans showing an extensor pollicis brevis tendon (between white arrows) that is thickened and demonstrates increased elasticity values (yellow and green) indicative of tendonitis and a thickened synovial sheath (black arrow) that exhibits higher elasticity values (blue).
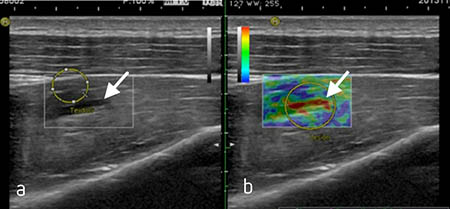
Figure 5. Grey scale (a) and compression elastographic (b) images. a. demonstrates a tear at the musculo-tendonous junction in one of the forearm muscles (arrow). b. depicts increased elasticity at the site of the tear and in the surrounding muscle.
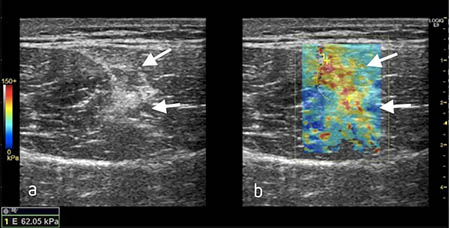
Figure 6. Grey scale (a) scan through a gastrocnemius muscle showing scar formation (arrows) at the site of an old tear. SWE scan (b) shows diminished tissue elasticity (red/yellow coding) within the scar, whilst normal adjacent muscle is blue.
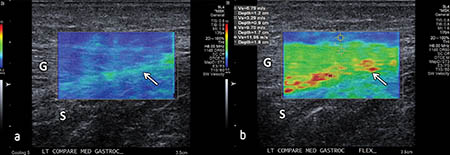
Figure 7. SWE scans of the gastrocnemius (G) and soleus (S) muscles with the intervening soleus fascia (arrow) displayed in longitudinal section in the relaxed (a) and contracted (b) states. Note that the elasticity is higher in the relaxed state of the muscles (blue) and fascia (blue/green) than in the contracted state with the muscles depicted green and the fascia shown in yellow/red.
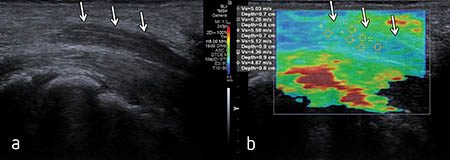
Figure 8. Grey scale (a) and SWE (b) scans of an inflamed median nerve within the carpal tunnel. (a) The grey scale image shows focal thickening and diminished echogenicity (arrows) within a section of the nerve. (b) SWE evaluation demonstrates diminished elasticity (green/yellow) (arrows) within the thickened portion of the nerve.