
The evolution of life expectancy in Malta over half a decade
Kathleen England,Tobias Vogt and Natasha Azzopardi Muscat
Abstract
An overview of life expectancy in Malta over the past sixty years shows a remarkable increase for both men and women. However, gains in life expectancy were not constant throughout the period. The rate of increase as well as the attributable causes of the noted increase varied over the years. Disparities in life expectancy by gender and by level of education exist. Life expectancy in Malta has caught up with Western Europe over the past 30 years and now compares well with the average for the EU-15. (The EU-15 consists of the 15 EU member states who became members in the European Union before 2004 and on average have the best life expectancies in the EU).
Introduction
The extension of the human lifespan has been significant in recent years, with world average life expectancy at birth having more than doubled over the past two centuries1 and rising by more than one-third in just the last four decades.2 Life expectancy is often used by countries as a measure of population health. It is an indicator that summarizes the mortality conditions in a country in a given year. Life expectancy at birth shows the number of years that a person can expect to live if current mortality conditions would prevail in the future.
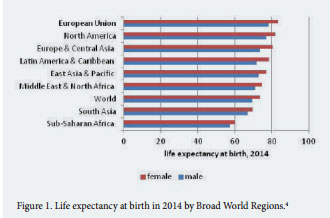
The world average life expectancy for males stood at 69 years for males and 73 years for females in 20153 with highest average life expectancies by broad regions being attained in Europe and North America (Figure 1).4 In sharp contrast, life expectancy gains have been modest in Africa. In fact, due to the impact of AIDS, during the 1990s life expectancy actually decreased; however, since 2005 mortality due to HIV/AIDS has been decreasing, allowing life expectancy at birth to increase again.5
The original “epidemiological transition” theory by Abdel Omran6 was the first attempt to explain the progress in healthcare made by industrialised countries over the past two centuries. Further refinements of the original theory were made and are described as the stages of the ‘health transition’.7 Between the turn of the 18th century and the 1960s, life expectancy improved dramatically from low levels of 30-35 years to reach about 70 years in the mid-1960s. This was primarily due to the reduction in mortality from infectious diseases. Improvements in living conditions, wealth and nutrition together with important public health measures including investment in safe drinking water and sewage systems were important measures responsible for major reductions in mortality from infectious diseases. This was followed by the introduction of immunisation and antibiotics. Since the 1970’s, we are experiencing a second stage in health transition relating to the reduction of cardiovascular disease, at least in high-income countries. More recently, some countries are now experiencing a third stage (possibly without having completed the previous one), which is the fight against ageing. However, these stages may occur at different times in different countries.7
The Situation in Malta
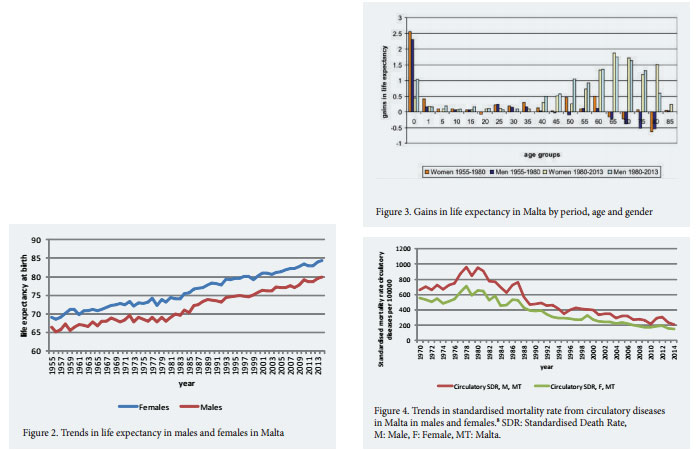
An overview of life expectancy in Malta over the past 60 years has shown a steady increase (Figure 2), with life expectancy in 2014 reaching 79.97 for men and 84.37 for women.8 However, it is well known that substantial disparities in average life expectancy exist and these are associated with socio-economic variables. Persons who have higher levels of education have a higher life expectancy at birth compared to those with lower education levels. This gap is wider for men than women i.e. Males: least educated 77.30, most educated 81.80; Females: least educated 82.40, most educated 84.10, in 2011.9
Over the past 60 years, gains in life expectancy varied from one decade to another. Detailed demographic analysis of gains between 1955 and 1980 reveal that the gains are attributable mainly to a fall in infant mortality, as seen in figure 3. During this period, life expectancy in the older age groups actually deteriorated resulting in an overall picture of life expectancy stagnation in the 1970s. The largest gains in life expectancy were experienced during the 1980s with more modest gains being made in the 1990s. These gains are mainly observed in the older age groups and are largely attributed to the start of a downward trend in circulatory mortality (Figure 4).
How does Malta’s life expectancy trajectory compare to the EU-15?
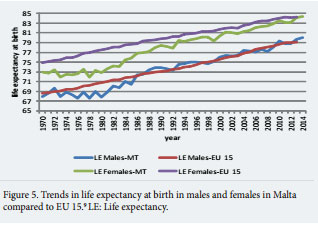
According to the data for 2014, the life expectancy for men (79.97) and women (84.37) in Malta compares well with that of EU-15 (life expectancy for EU-15 stood at 79.06 for males and 84.23 for females); however, this has not always been the case. Figure 5 shows how life expectancy for women in Malta has been persistently lower than that of EU-15 and only seems to catch up now. In men life expectancy improvement lagged behind in the 1970s but caught up in the latter half of the 1980s and has largely remained similar to the EU-15 since then.
A gender gap of around 4.5 years in life expectancy exists between men and women in Malta. This gap has remained relatively stable over the past 40 years. The gender gap in life expectancy varies substantially between different EU-28 member states with large differences between the sexes found in Lithuania (11.1 years in 2013), and smaller differences found in the Netherlands, United Kingdom and Sweden (3.7, 3.7 and 3.6 respectively).10
Extreme Longevity for more people
The current data for Malta shows that the oldest recorded female death occurred at 109 years and the oldest male death occurred at 106 years. In the 1950s, deaths in the 85 plus age group accounted for 5% in men and 8% in women. In 2014 they accounted for 23% and 43% of all deaths respectively.11 Moreover, the old age dependency ratio (represents the number of people aged 65 years and over per workers aged 15-64 years) increased from 12% and 13% in males and females respectively in 1955 to 23% and 31% in 2014. Whether extra years of life gained through increased longevity are spent in good or bad health is a crucial question. In this context indicators of health such as healthy life expectancy (HLE) are of increasing interest. HLE is defined as the number of years that a person is expected to continue to live in a healthy condition (in absence of diseases or disabilities). In 2013, the HLE at age 65 was estimated at 12.7 years for females and 12.8 for males in Malta, well above the EU-28 average (8.6, 8.5 respectively).12 It is of note that the gender gap observed with life expectancy disappears when considering HLE, indicating that the additional life expectancy in females tend to be lived with decreased health and with activity limitations.
Discussion and Conclusions
This article has described the evolution of life expectancy in Malta over the past sixty years. It has highlighted the gender differences as well as the periods that have contributed greatest to the gains to life expectancy.
Contributions to gains in life expectancy reach far beyond the health sphere alone. While recent advances in life expectancy, at least in high-income countries, were largely due to declines in mortality from circulatory disease, this appears to be dependent on their economic growth. Transmission of knowledge and technology for the control of circulatory diseases from higher to lower income countries in Europe does not suffice and the answer may lie in developing stronger and more equitable economic conditions.13
Gains in life expectancy in high income countries are resulting in an increase in the old age dependency ratio. In these countries ‘expected lifetime labour force participation as a percentage of life expectancy is declining’.14 As studies suggest that life expectancy will continue to increase in the years to come,15,16 countries facing such increase in longevity need to develop policies which will allow sustainable public pension and health care plans.
Notwithstanding this, not all countries have the same aging pattern, and migration of workers from younger, often poorer countries, to older, often richer countries, may serve to balance the global distribution of labour and capital.2
References
1. Oeppen J, Vaupel J. Broken limits to Life Expectancy. Science 2002;296(5570):1029-1031. 2. Palacios R. The future of global ageing. Int. J. Epidemiol 2002;31:786-791. 3. Population Reference Bureau. 2016. Available from: http://www.prb.org/ Publications/Datasheets/2015/2015-world-population-data-sheet/worldmap.aspx#table/world/lifeexp/lexpall. 4. World Bank Database. 2016. Available from: http://databank.worldbank. org/data/ 5. World Health Organisation. Global Health Observatory (GHO) data: Life Expectancy. 2016. Available from: http://www.who.int/gho/mortality_ burden_disease/life_tables/situation_trends_text/en/ 6. Omran A. The epidemiologic transition: a theory of the epidemiology of population change. Milbank Memorial Fund Quarterly 1971;49(4):509-538. 7. Vallin J, Mesle F. Convergences and divergences in mortality. A new approach to health transition. Demographic Research – Special collection 2, article 2. 2004:11-44. 8. World Health Organisation. Health for All [Database]. 2016. Available from: http://www.euro.who.int/en/data-and-evidence/databases/europeanhealth-for-all-database-hfa-db 9. European Commission. . European Core Health Indicators. 2011. Available from: http://ec.europa.eu/health/social_determinants/indicators/index_ en.htm 10. Eurostat. Statistics Explained: Mortality and life expectancy statistics. 2016. Available from: http://ec.europa.eu/eurostat/statistics-explained/ 11. Directorate for Health Information and Research. Malta National Mortality Registry. 2016. Available from: http://health.gov.mt/en/dhir/Pages/ Registries/deaths.aspx 12. Eurostat. Healthy Life Years Statistics. 2016. Available from: http:// ec.europa.eu/eurostat/statistics-explained/index.php/Healthy_life_years_ statistics. 13. Mackenbach J, Looman C. Life expectancy and national income in Europe, 1900-2008: an update of Preston’s analysis. Int. J. Epidemiol 2013;42:1100- 1110. 14. Eggleston K, Fuchs V. The new demographic transition: Most gains in life expectancy now realised late in life. J. Econ. Perspect 2012;26(3):137–156. 15. Bongaarts J. ‘How long will we live?’. Popul Dev Rev 2006; 32(4): 605-628. 16. Wilmoth JR, Robine JM. The world trend in maximum life span. Popul Dev Rev 2003; 29:239-257.
