
Imaging Diffuse Liver Disease – Part II
by Pierre Vassallo
MD PhD FACA Artz fur Radiologie
Consultant Radiologist
CT scan protocols for the liver may be classified single-, dual- or triple-phase techniques. An initial non-contrast enhanced scan is obtained with all three techniques. In the case of a single phase technique, the nonenhanced scan is followed by a scan in the portal venous phase (40 seconds after the peak aortic enhancement). In the dual-phase technique, scans are obtained in the late hepatic arterial phase (20 seconds after peak aortic enhancement) and in the portal venous phase. In the triple-phase technique, late arterial and late portal venous scans are followed by a hepatic venous phase scan (60 seconds after peak aortic enhancement).
Single phase scans are practical when whole body scans are required usually for cancer staging. Single phase scans acquire images of the liver prior to contrast injection and during the portal venous phase (ie 40 seconds after peak aortic enhancement) (Figure 1).
Dual phase scans are performed in cases with a known or suspected hypervascular primary neoplasm outside the liver for which hypervascular hepatic metastases are suspected. Confirmed or suspected diagnoses of breast carcinoma, renal cell carcinoma, melanoma, neuroendocrine tumors, and thyroid carcinoma would call for the dual-phase hepatic imaging protocol (Figure 2).
Triple phase scans are used in cases of known or suspected cirrhosis or hepatocellular carcinoma as well as suspected benign primary liver lesions such as focal nodular hyperplasia or hepatic adenoma. A further delayed phase performed 10–15 minutes after peak aortic enhancement; this will demonstrate the pathophysiologic phenomenon of delayed contrast agent washin and washout that occurs in these lesions allowing them to appear denser than normal liver parenchyma during this phase (Figure 3).
The most common indication for liver CT is to exclude, confirm or monitor hepatic metastatic disease; single and in some cases dual phase scans are adequate for such cases. Triple phase scans are reserved for particular cases where information about a primary hepatic lesion or diffuse liver disease is required. Below I will discuss some of the more common indications of a triple phase CT scan.
Storage Diseases
Hepatic steatosis represents the excessive accumulation of triglycerides within the hepatocytes, a phenomenon that can affect hepatic parenchyma focally or diffusely. At the hepatocellular level, three underlying pathophysiologic phenomena have been identified that contribute to fatty infiltration of hepatic parenchyma: decreased mitochondrial fatty acid beta-oxidation, increased endogenous fatty acid synthesis or enhanced alimentary delivery of fatty acids leading to hypertriglyceridemia, and deficient incorporation or export of lipoproteins. Fatty liver disease can cover a severity spectrum ranging from dormant noninflammatory fatty liver, to steatohepatitis with inflammation, fibrosis, and eventually cirrhosis.
All severities of fatty liver disease can be associated with the use of alcohol. In the absence of alcohol consumption, nonalcoholic fatty liver disease is most commonly associated with obesity, type 2 diabetes mellitus, and dyslipidemia. It can also manifest as an aggressive subtype characterized by hepatocyte ballooning and necrosis, with and without Mallory hyaline and fibrosis, called nonalcoholic steatohepatitis (NASH). Several other clinical disorders and scenarios including malnutrition, severe hepatitis, corticosteroid use, pregnancy, drug toxic effects, malaria, kwashiorkor, Reye syndrome, and chemotherapy also lead to fatty liver disease (Figure 4).
At unenhanced hepatic CT, fatty infiltration results in a lowering of the attenuation of the liver parenchyma. In normal adults, the attenuation value of the liver is consistently higher than that of the spleen. Mild degrees of diffuse fatty infiltration can be diagnosed when the attenuation value of the liver parenchyma is slightly less than that of the spleen; marked steatosis hepatis leads to attenuation levels lower than that of the intrahepatic blood vessels. Contrast enhanced CT scans are less reliable in detecting fatty infiltration of the liver. After contrast material administration, significant fatty infiltration can be suggested if the liver attenuation is less than that of muscle.
Wilson’s disease is an autosomal recessive disease characterized by increased intestinal uptake of copper and subsequent deposition, predominantly in the liver and basal ganglia. Wilson’s disease can manifest as acute and even fulminant hepatitis with rapid progression into mostly macronodular-type cirrhosis. Clinically, patients present with very low levels of ceruloplasmin. Rarely malignant transformation into hepatocellular carcinoma may occur.
Hepatic CT may demonstrate nonspecific increased liver parenchymal density related to the copper deposition (Figure 5). However, Wilson’s disease may also be accompanied by diffuse fatty infiltration, which decreases the attenuation at hepatic CT. Clinical correlation and rarely ultrasound guided liver biopsy may be required for confirmation in these cases.
All known variants of identified glycogen storage diseases are inherited autosomal recessive disorders and are characterized by absence or deficiency of one of the enzymes responsible for producing or metabolizing glycogen. Different enzyme deficiencies cause either abnormal concentrations of glycogen or abnormally formed glycogen. Different subtypes of glycogen storage disease involve the liver, musculature, haematopoietic system, myocardium, and kidneys. Types Ia (von Gierke), Ib, II (Pompe), III (Forbes), IV (Anderson), VI, and IX have the cardinal symptom of hepatomegaly.
Types Ia and Ib have the potential to undergo malignant transformation to form hepatocellular carcinomas, whereas types III and IV progress to development of cirrhosis. In types Ia, Ib, and III, an increased prevalence of hepatic adenomas has been observed (Figure 6). In all children in whom hepatomegaly in combination with hypoglycemia, growth retardation, and disproportional distribution of body fat is detected, the diagnosis of glycogen storage disease should be considered.
Lipid storage diseases represent a diverse family of diseases that result from an enzymatic deficiency of a lysosomal hydrolase. This leads to lysosomal accumulation of sphingolipids. Sphingolipid substrate storage in visceral cells can lead to organomegaly. However, the main target organ is the central nervous system, the feature responsible for the predominantly neurodegenerative course of lipid storage diseases. Numerous subtypes of lipid storage diseases have been identified that are classified according which enzyme is deficient: GM1 and GM2 gangliosidosis, Gaucher disease, Niemann- Pick disease, Fabry disease, Schindler disease to name a few. Most of these diseases may manifest as an enlarged liver due to lipid and cholesterol deposition, leading to cirrhosis and chronic liver failure before adulthood). CT imaging of the liver shows hepatomegaly with accompanying steatosis hepatis as nonspecific imaging findings (Figure 7).
Deficient activity of the enzymes regulating the catabolism of glucosamine glycans leads to the accumulation of excess mucopolysaccharides in tissues, as well as excretion of specific metabolites in the urine. The more common mucopolysaccharidoses including type I (Hurler), type II (Hunter), type III (San Filippo), type VI (Maroteaux-Lamy), type VIIb all have hepatic manifestations. At pathomorphologic analysis, hepatomegaly, diffuse fibrosis and a micronodular cirrhotic pattern can be observed. CT imaging of the liver shows cirrhotic changes as a nonspecific imaging finding.
Vascular Disorders
Vascular stasis, hypercoagulability states and endothelial disruption (Virchow’s triad) are known to be main mechanisms that cause thrombosis. Portal venous stasis caused by cirrhosis, hepatocellular carcinoma or pancreatic carcinoma may lead to portal venous thrombosis. Sepsis, direct trauma, inflammatory bowel disease and phlebitis all lead to endothelial damage that may result in portal venous thrombosis. Portal venous thrombosis is usually a transient condition, however if it involves the smaller intrahepatic branches revascularisation will not occur. When it persists, cavernous transformation of the porta hepatis occurs with the formation of numerous collateral venous channels that replace the main portal vein. CT will show both thrombosis of the portal vein and the sponge-like conglomerate of veins replacing it in the porta hepatis (Figure 8). It may also demonstrate the cause of the portal vein thrombosis.
Budd-Chiari syndrome results from occlusion of the hepatic veins and is classified into 3 types: Type 1 involves occlusion of the inferior vena cava, in type 2 there is occlusion of the major hepatic veins while in type 3 veno-occlusive disease of the liver or progressive thrombotic occlusion of small centrilobular veins is present. Stasis in the hepatic veins or IVC may result from external compression by a hepatic or retroperitoneal tumour or due to increased intraluminal pressure by congestive heart failure, constrictive pericarditis or a right atrial myxoma. CT can confirm hepatic venous or IVC thrombosis and can help identify the cause (Figure 9).
Congestive heart failure results in stasis and increased pressure in the hepatic veins with hepatic congestion that if persistent for a long time will lead to hepatocyte necrosis, fibrosis and micronodular cirrhosis. In such cases, CT will demonstrate hepatic venous widening and evidence of cirrhosis.
Hepatic arterial occlusion is rare and is more frequently seen in transplant livers due to direct trauma. It is otherwise the result of embolic disease. The hepatic artery contributes only 25% of the liver’s blood supply and if occluded does not grossly disrupt liver function. Metastases and primary liver tumours have been noted to receive most of their blood supply from the hepatic artery and chemo-embolisation of the hepatic artery is one of the treatment methods used to control tumour growth. Occlusion of the hepatic arteries, therapeutic or otherwise, is readily assessed by CT.
Significant liver infarction only occurs when both hepatic arterial and portal venous occlusion occur. Such situations include acute shock, trauma and hypercoagulability, as well as preeclampsia or HELLP (hemolytic anemia, elevated liver enzymes, low platelets) syndrome and as a vascular complication after liver transplantation. CT will show the zone of infarction as a wedge shaped area of low density that follows the segmental vascular anatomy of the liver.
Inflammatory diseases of the liver
Viral hepatitis results in cellular alterations with varying degrees of periportal hepatocellular necrosis, Kupffer cell mobilization, and portal infiltration with plasma cells depending on the underlying infectious, toxic, or autoimmune cause. These inflammatory entities can be self-limiting, progress to segmental scarring, or end in an overall cirrhotic state. The acute variant of hepatitis lasts less than 6 months; chronic hepatitis represents any inflammatory condition of the hepatic parenchyma that does not show signs of regression for periods longer than 6 months.
CT of acute and fulminant courses of hepatitis shows generalized hepatomegaly combined with peripheral edema. Furthermore, nonenhanced CT can show heterogeneous attenuation patterns. The overall hepatic parenchymal attenuation is usually equal to or less than that of the spleen. Contrast-enhanced CT can demonstrate irregular perfusion with heterogeneous regions of diminished attenuation (Figure 10).
Conclusion
The aim of this article was to demonstrate the prominent role of CT for the diagnosis of diffuse liver disease primarily due its excellent morphologic visualization capabilities.
Figure Legends
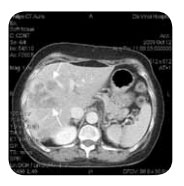
Figure 1. Part of a whole body scan to stage colon cancer, liver metastases are present (arrows).
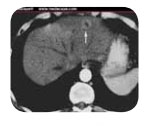
Figure 2. Dual phase scanning allows better demonstration of hypervascular metastasis (arrow).
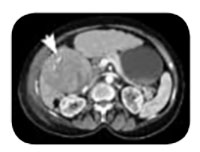
Figure 3. Primary hepatic tumors demonstrate delayed washout (arrow) on this delayed phase image from a triple phase scan.
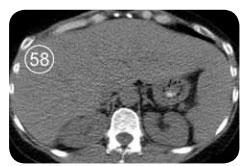
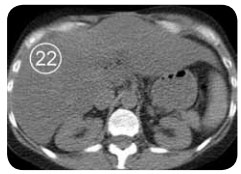
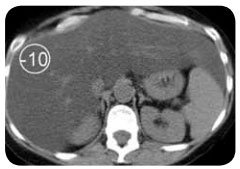
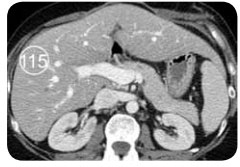
Figure 4. Fatty infiltration of the liver parenchyma in a 46-year-old woman with ovarian cancer who was undergoing chemotherapy. Sequential nonenhanced (a–c) and portal venous perfusion phase contrast material–enhanced (d) CT scans obtained at 3-month intervals show a progressive decrease in hepatic attenuation. Circle = region of density measurement, number = attenuation in Hounsfield units.
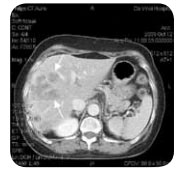
Figure 5. Histologically proved Wilson disease in a 41-year-old man. Nonenhanced CT scan shows increased attenuation of the hepatic parenchyma.
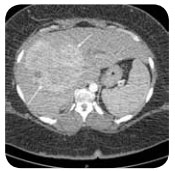
Figure 6. Hepatic adenoma (arrows) in type 1a (von Gierke) glycogen storage disease.
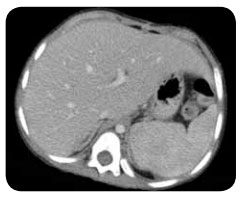
Figure 7. Niemann-Pick disease in an 11-year-old girl. Portal venous phase image shows hepatomegaly and splenomegaly.