
CT Imaging of Coronary Artery Disease
by Pierre Vassallo
Cardiovascular disease is the most common cause of death in developed countries. Particularly with regard to coronary artery disease, approximately 19 million people yearly worldwide either have acute coronary syndrome or die of sudden cardiac death. Thus, early identification and an accurate risk assessment of atherosclerotic disease are mandatory for improvement in the early identification, management, and prevention of acute coronary syndrome.
Coronary artery lumen diameter primarily assessed invasive coronary angiography has been considered to gold standard for assessing risk of an acute coronary event. However histopathologic data have shown that plaque composition and vunerability may have a greater influence on the risk of acute coronary syndrome and cardiac death.
With the advent of non-invasive CT coronary angiography, it is now possible to accurately and safely screen for coronary artery stenosis particularly for individuals with risk factors as assessed by the Framingham and Reynolds classifications in a cost efficient manner.
CT coronary calcium scoring is an additional method that allows assessment of the extent of coronary artery disease by non-invasively measuring intramural calcium (Fig 1). This score is an indicator of your level of hard plaque burden. A very low score suggests that there is virtually no obstructive disease in the coronary arteries, whereas a high score indicates that the level of hard plaque burden is extensive and the risk of a future cardiac event is significant. The following chart outlines the specific ranges of scores and their significance.
| Score Level | Hard Plaque Burden | Level of Significant Risk of CAD | Recommendations |
| 0 | None | Extremely low | Patient should maintain a healthy diet that is low in saturated fat and cholesterol, refrain from smoking, maintain ideal body weight, and exercise regularly. |
| 1–10 | Minimal | Very unlikely | All of the above PLUS close control of diabetes and high blood pressure, and possibly the use of statins for high cholesterol. |
| 11-100 | Mild | Mild to moderate | All of the above PLUS daily aspirin, statins for high cholesterol, and estrogen for postmenopausal women. |
| 101–399 | Moderate | Moderate to high | All of the above PLUS use of folic acid, and possibly stress testing for further risk assessment. |
| 400 or greater | Extensive | High to very high | All of the above PLUS stress testing to assess extent of obstructive disease, and possibly cardiac angiography |
A CT coronary calcium score >400 should prompt further evaluation with invasive coronary angiography as there is a strong likelihood that one would need to proceed to angioplasty or stenting. In addition, heavy intramural calcium load interferes with accurate assessment of luminal diameter on CT coronary angiography. With a CT coronary calcium score < 400 one should proceed to CT coronary angiography, which will guide further follow-up or intervention (Fig 2).
CT coronary angiography is technically more challenging than other CT applications because of the continuously moving heart. In this matter, the development of electrocardiographically synchronized CT scanning and reconstruction techniques have allowed cardiac imaging with the reduction of motion artifacts. In addition, fast volume coverage and high spatial and temporal resolution represent further prerequisites for artifact-free imaging. In this regard, 64-section CT systems have met the technical conditions for high-quality cardiac and coronary artery imaging. The submillimeter section collimation (circa 0.6 mm) and high temporal resolution of current CT technology result in excellent diagnostic accuracy for the identification of significant stenosis, compared with conventional coronary angiography.
During recent years as stated earlier, plaque composition has been receiving a lot attention on the research front, as plaque stability or vulnerability (as opposed to relatively stable luminal stenosis) is likely to play a very important role in acute cardiac events. Findings from multiple clinical trials and invasive imaging with optical coherence tomography and intravascular ultrasonography, have contributed to a better understanding of the relative importance of stenosis for risk prediction and have led to a change of focus from luminal narrowing to structural, haemodynamic, and metabolic assessment, including evaluation of plaque morphology and composition, fractional flow reserve, and the degree of inflammation and metabolic activity.
The earliest stage of atherosclerosis is characterized by endothelial dysfunction that results from endothelial injury. Endothelial dysfunction is associated with a reduction in the bioavailability of nitric oxide, which in turn reduces the anti-thrombotic properties of the endothelial surface and promotes adhesion and subsequent transmigration of leukocytes. Subsequent intimal thickening and later formation of fatty streaks characterize this early lesion, which contains lipid-filled macrophages (foam cells) and T lymphocytes. Inflamed fatty streaks represent a precursor of atherosclerotic plaque formation.
The atherosclerotic plaque classification scheme of the American Heart Association (AHA) implies an orderly linear pattern of lesion progression, whereas the modified AHA scheme is a comprehensive morphologic classification scheme that does not imply that there is a single sequence during the lesion progression and is able to deal with a wide spectrum of morphologic variations. On the basis of the modified AHA scheme, atherosclerotic plaque can be differentiated into early and advanced lesions: Early lesions include (a) adaptive intimal thickening, (b) fibrous plaques, and (c) pathologic intimal thickening. More advanced lesions include (a) early fibroatheromas, (b) late fibroatheromas, and (c) thin-cap fibroatheroma, which is defined as a fibrous cap overlying the necrotic core in a fibroatheroma with a cap thickness of less than 65 μm.Most major adverse cardiovascular events result from plaque rupture in thin-cap fibroatheromas. The histologic characteristics of these vulnerable plaques include a thin fibrous cap, an underlying lipid-rich necrotic core, and an abundance of inflammatory cells.
In addition to the delineation of the coronary artery lumen and the identification of coronary stenosis, coronary CT permits the accurate detection of atherosclerotic plaque.
Early fibroatheroma may be visualized on cross-sectional CT image as a mixed coronary artery plaque with noncalcified and calcified components (Fig 3).Abnormal intimal thickening appears as concentric thickening of the arterial wall on a cross-sectional CT image (Fig 4), and is distinguished from coronary artery plaque as the latter is eccentric (Fig 5).The appearance of a core of low CT attenuation surrounded by a rimlikehyperattenuating area (also known as the “napkin-ring sign”) has been correlated with the presence of a necrotic core in vulnerable plaques (ie, thin-cap fibroatheroma) (Fig 6).
Recent research demonstrated that due to increased metabolic activity within vulnerable plaques, PET FDG (positron emmission tomography with fluoro-deoxyglucose) may have a role to play in plaque imaging. Increase FDG uptake occurs mainly due to the presence of activated macrophages in inflammed unstable plaques that are strongly avid for glycogen. Cardiac motion and the high metabolic activity of adjacent myocardium, presently pose limitations to this technique. However, the technique has been shown to clearly demonstrate increased plaque metabolic activity and consequently vulnerability (Fig 7).
New technologies are now available to evaluate a patient’s risk for coronary events. Although not all the above techniques mentioned above are clinically available, a basic screening procedure with non-invasive imaging can easily be implimented in our daily practice. CT coronary calcium scoring and CT coronary angiography are easily accessible and will allow selection of patient’s who require invasive diagnostic and therapeutic procedures.
Figure Legends
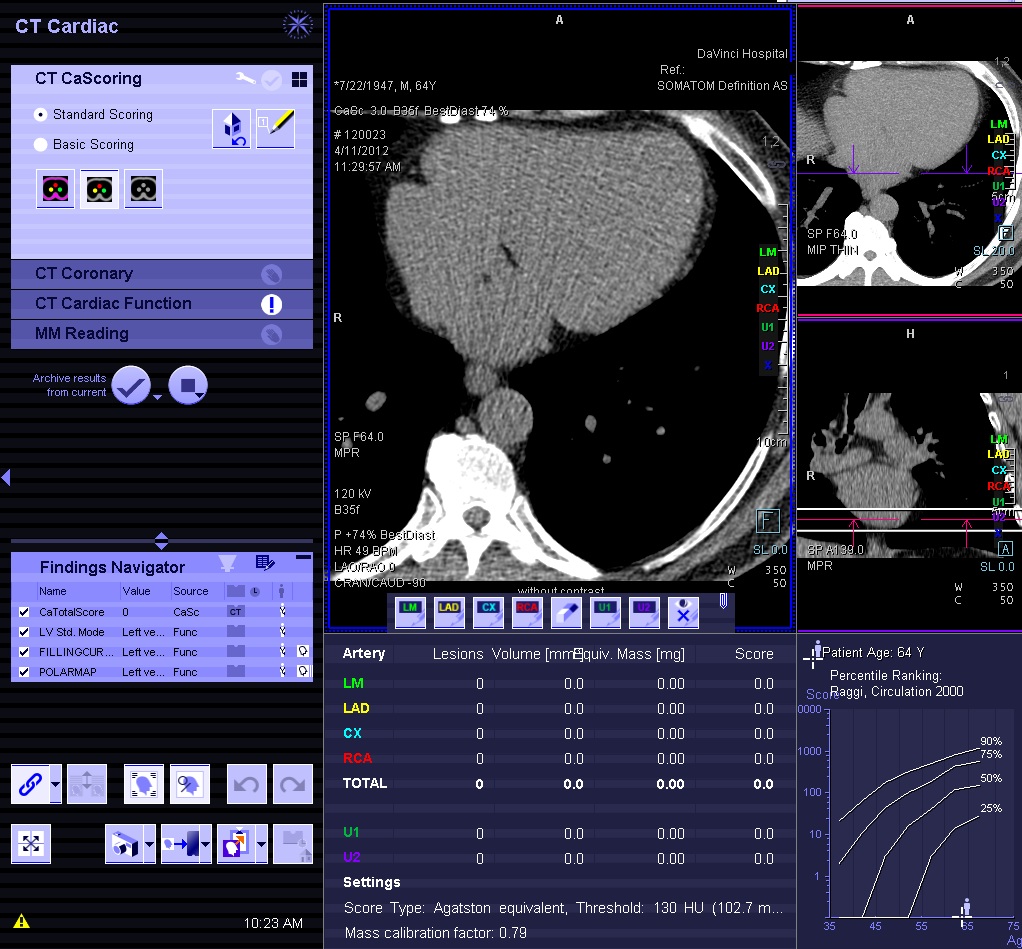
Figure 1. CT coronary calcium scoring: A 0 calcium score indicated that there are no measurable calcium deposits in the coronary arteries with a corresponding low risk for coronary artery disease.
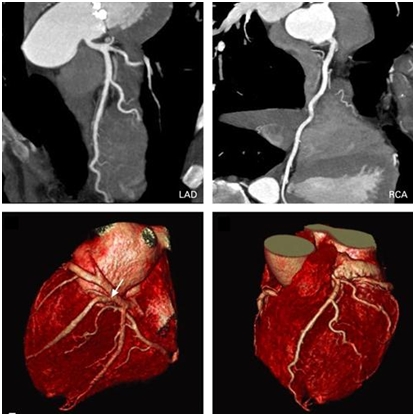
Figure 2. CT coronary angiography accurately and non-invasively assesses arterial diameter and mural irregularity.
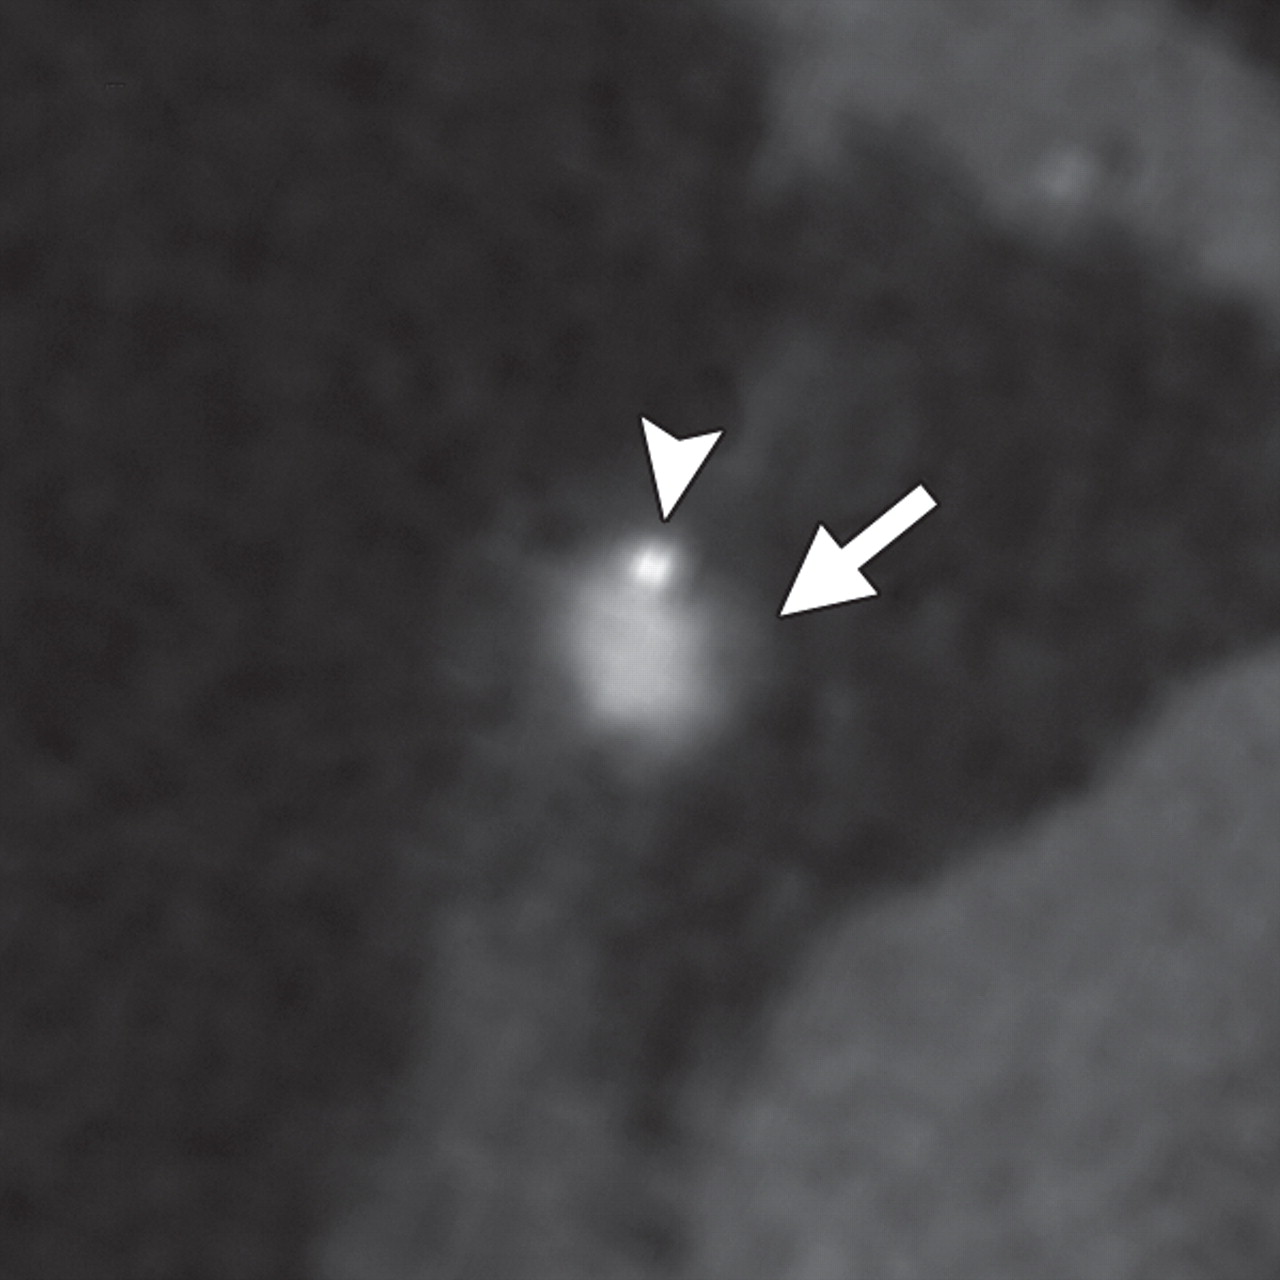
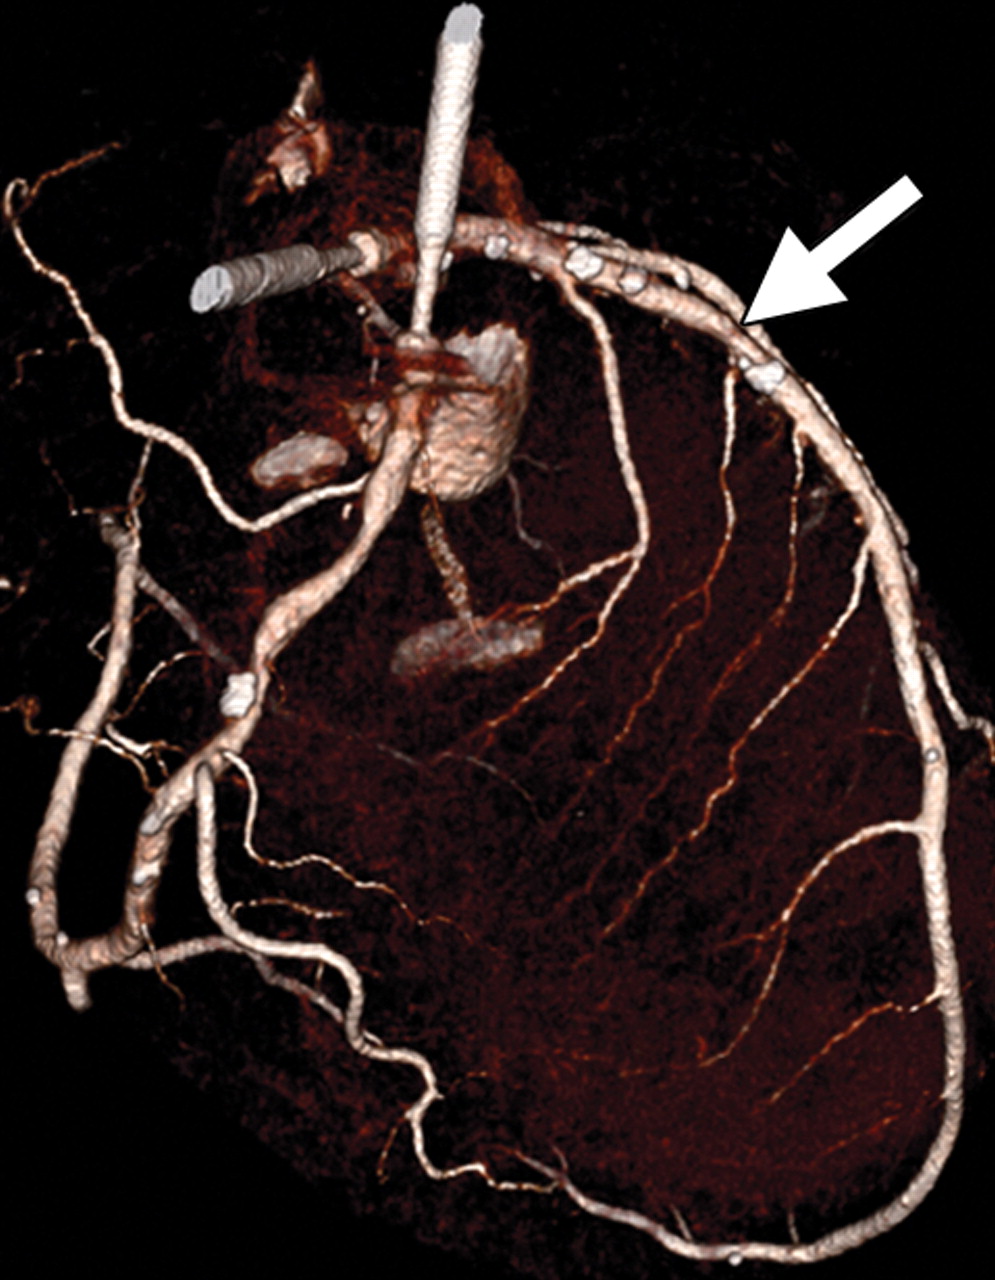
Figure 3.Early fibroatheroma cross-sectional CT image clearly depicts mixed coronary artery plaque with noncalcified (arrow) and calcified (arrowhead) components. (b) Volume-rendered CT image shows location of the plaque (arrow).
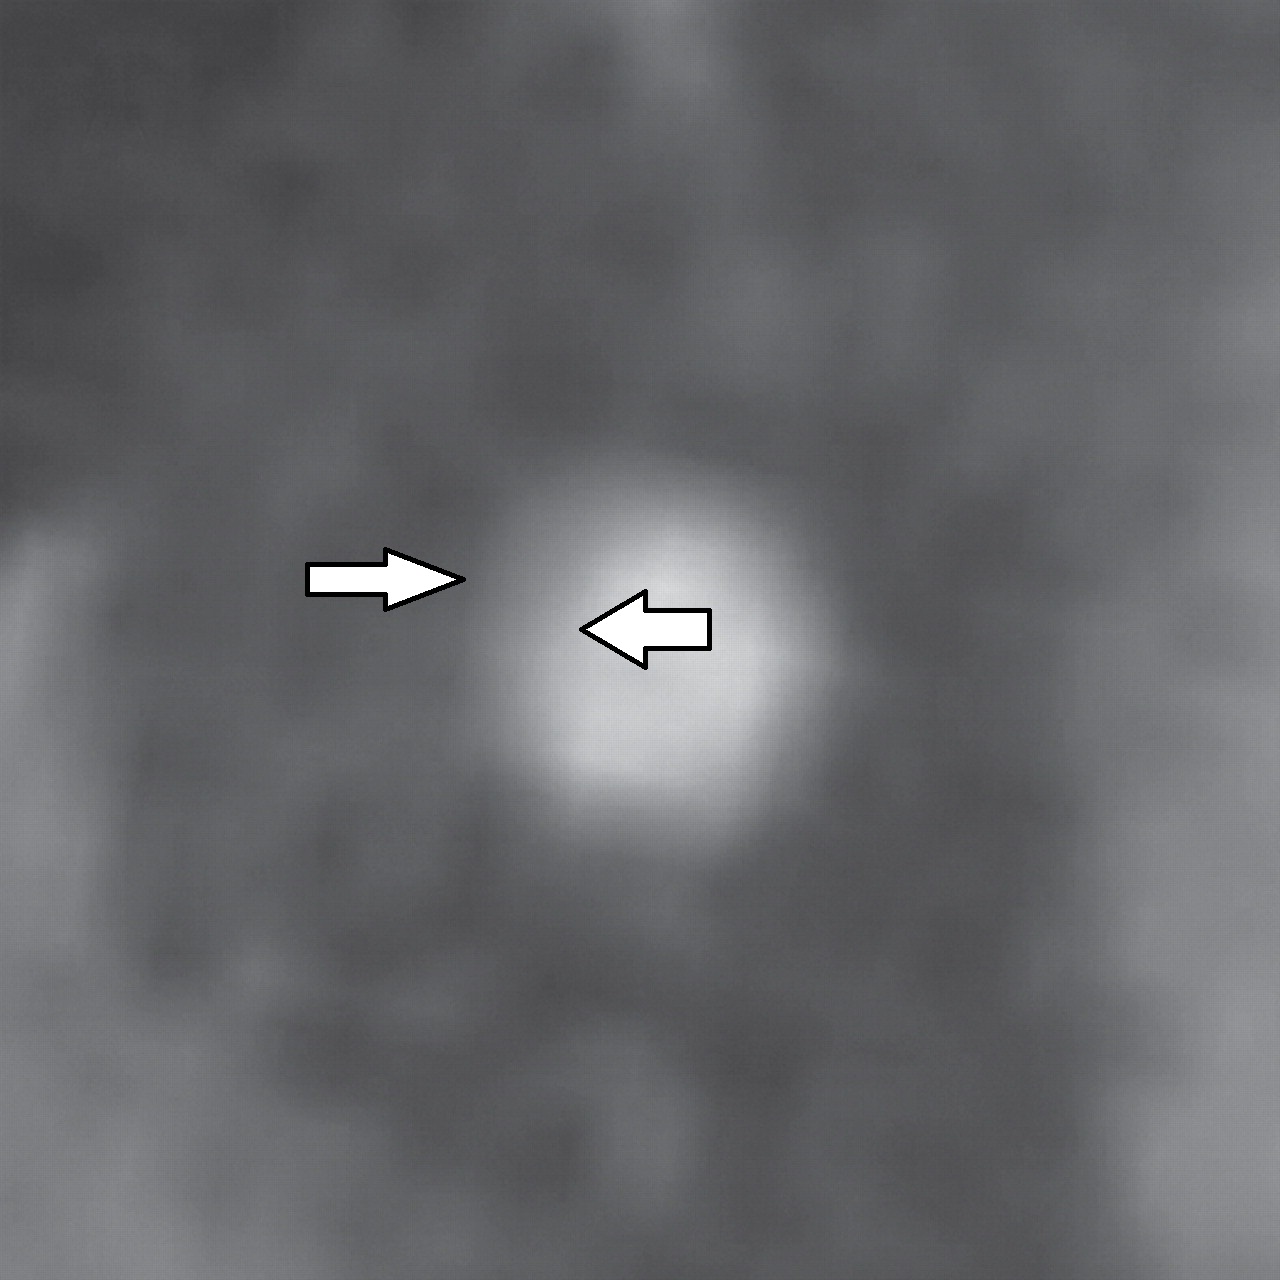
Figure 4. Abnormal intimal thickening (arrows) seen on a cross-sectional CT image of the middle portion of the right coronary artery; there is no coronary artery plaque.
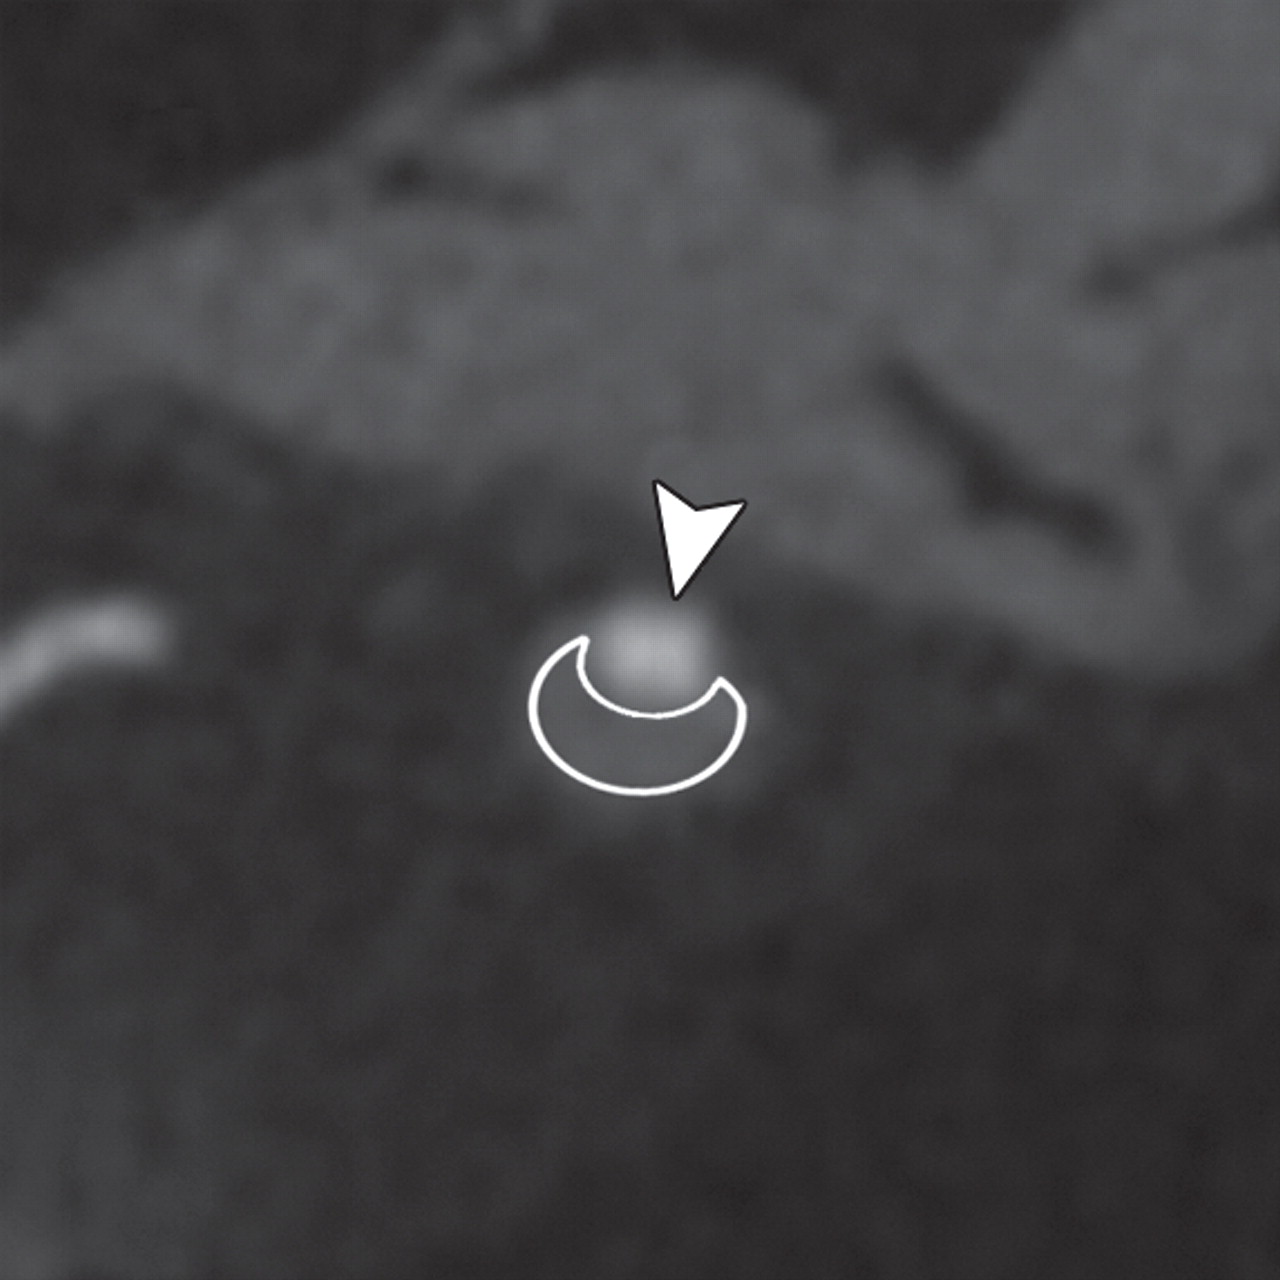
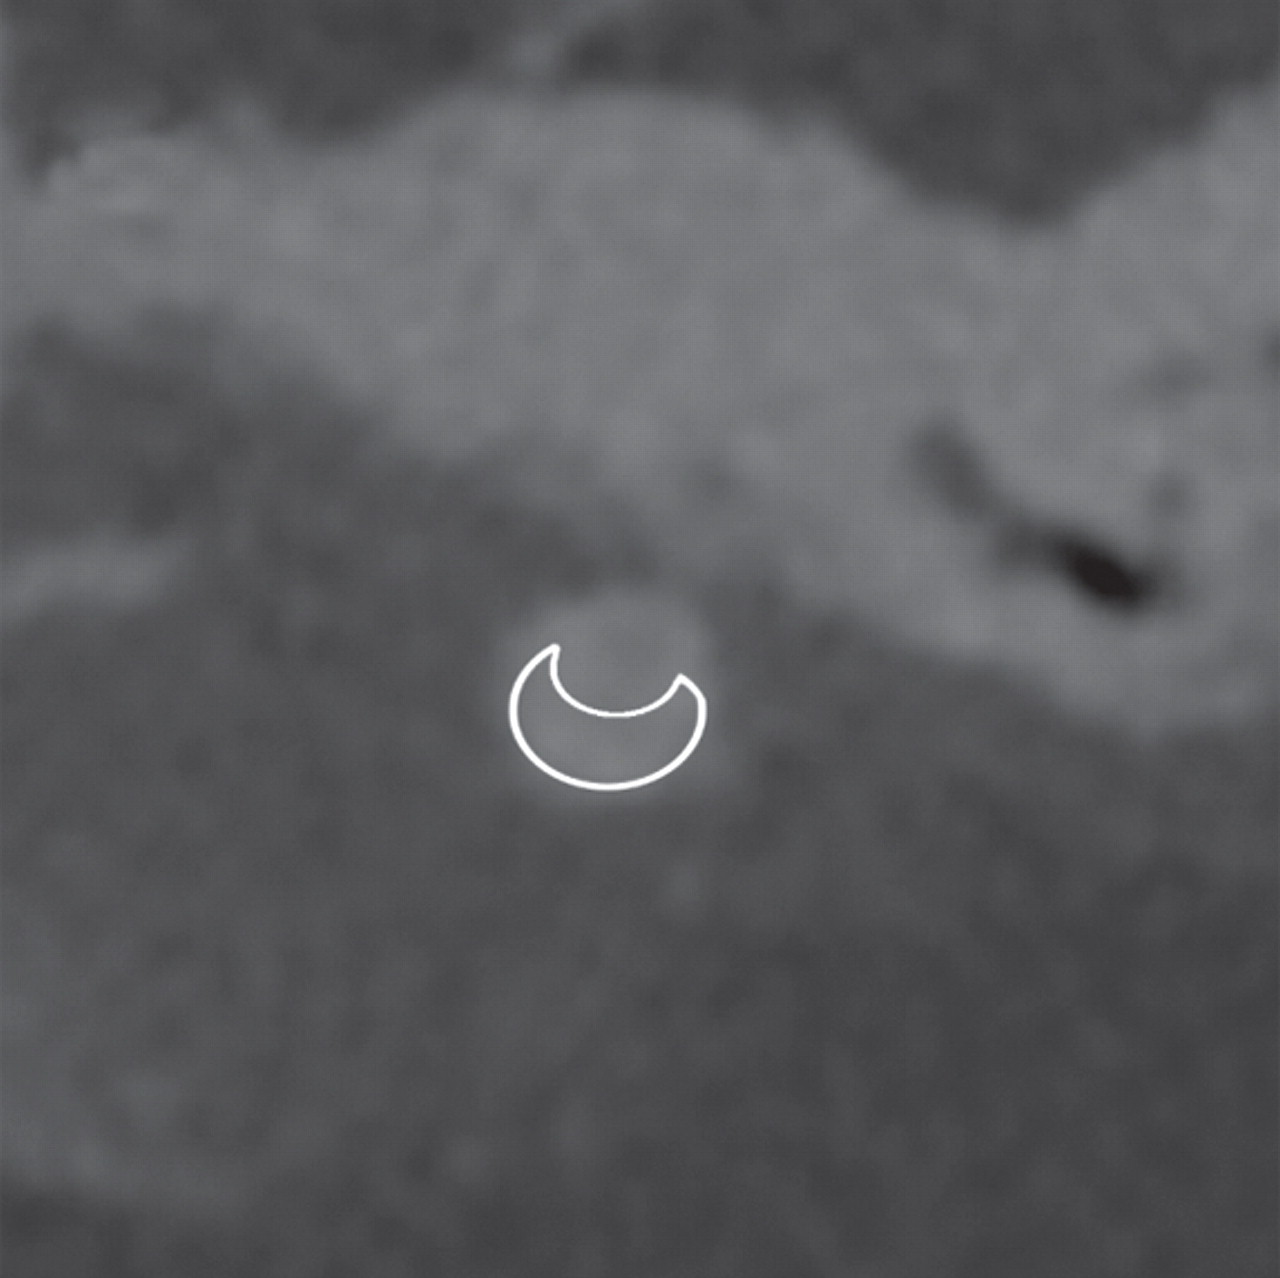
Figure 5. Late fibroatheromais seen on cross-sectional contrast-enhanced (a) and nonenhanced (b) CT images. No calcification is seen within the plaque (outlined area). Arrow head incidates contrast material in the perfused lumen.
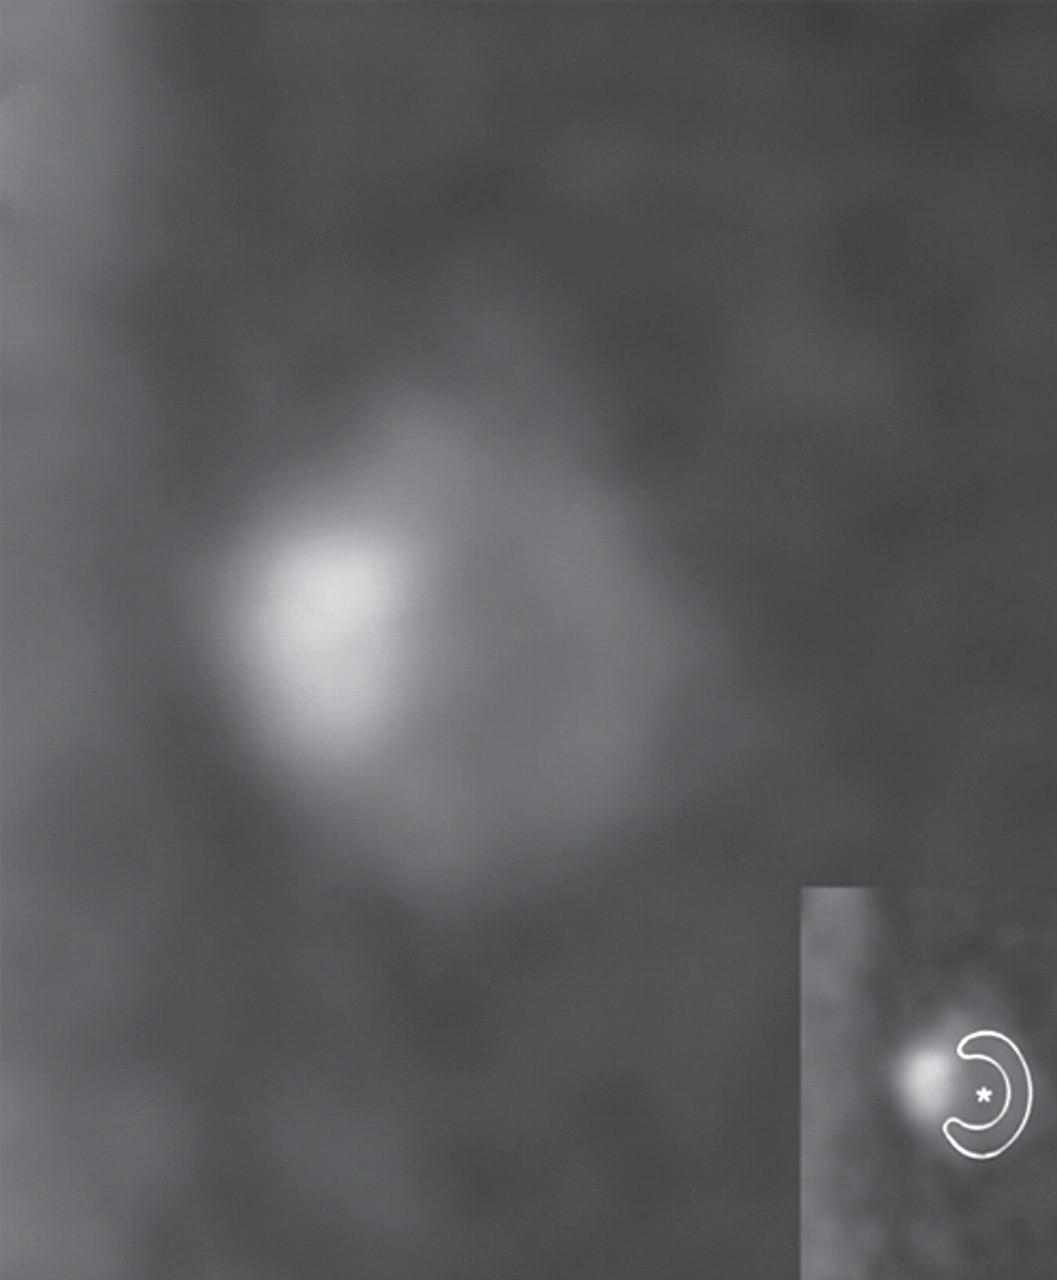

Figure 6. Vulnerable plaque seen on cross-sectional contrast-enhanced (a) and non-enhanced (b) CT image depicts plaque with the napkin-ring sign; there is a low density area (*) surronded by a denser rim located in the arterial wall (outlined area in insets). The area of high density in (a) represents the contrast agent filled arterial lumen.
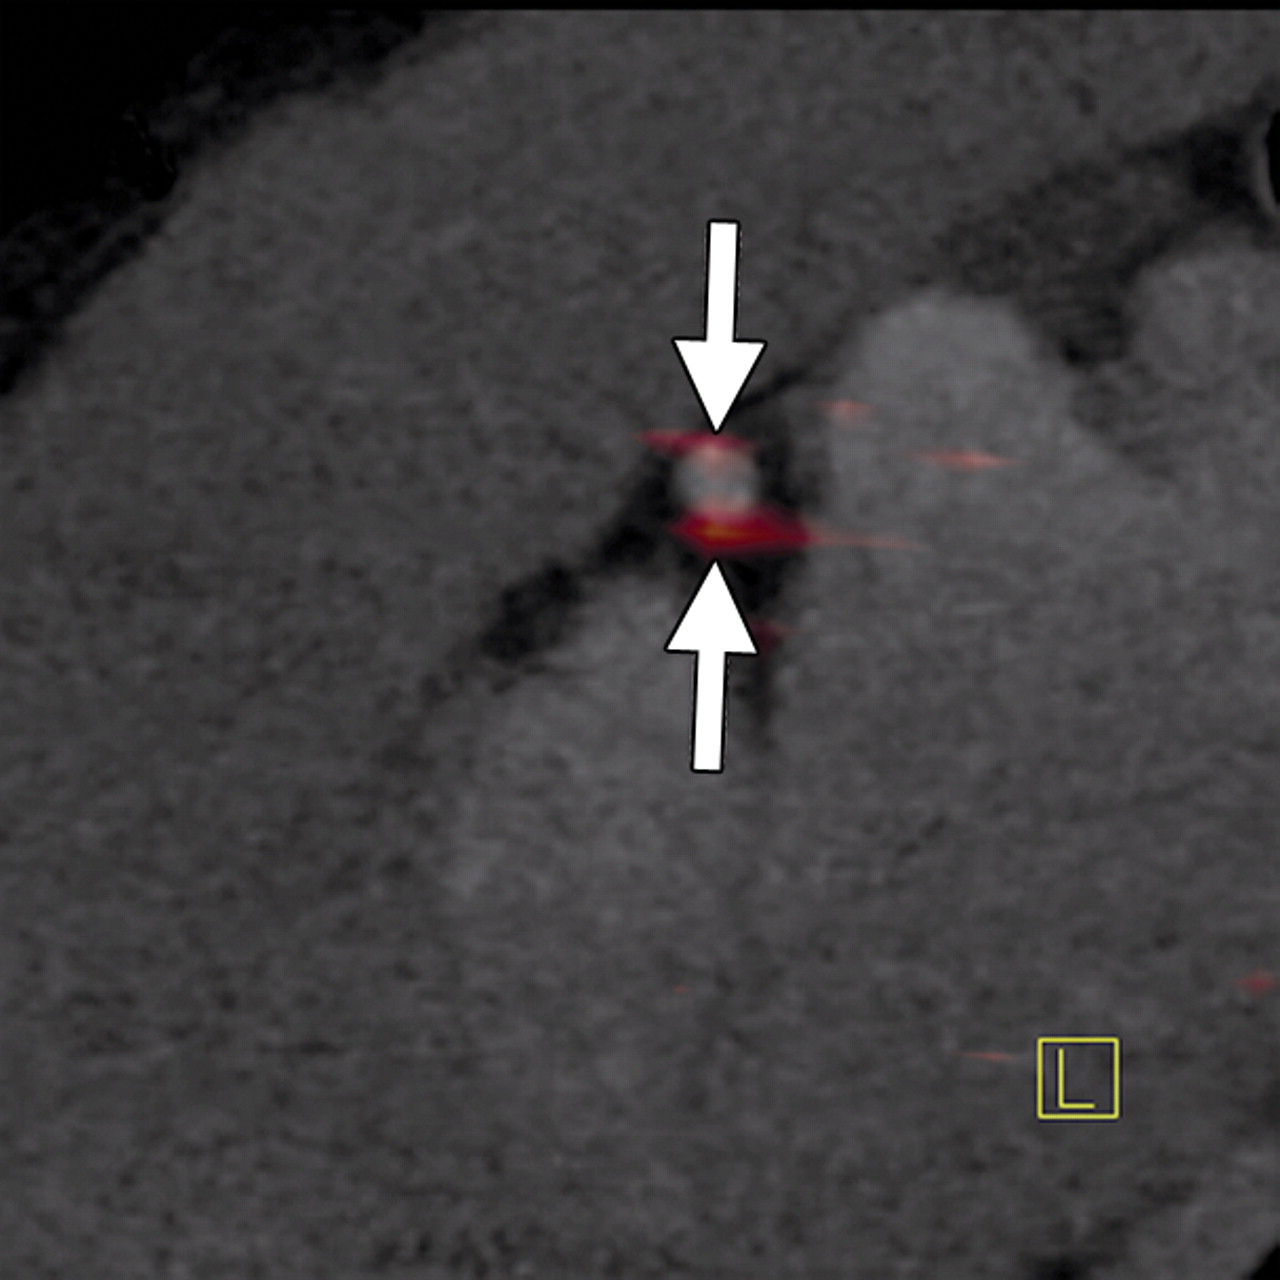
Figure 7. FDG uptake of coronary atherosclerosis is depicted on a co-registered sagittal PET/CT image.